Mahakam has a metrics middleware that you can use to collect metrics from the request body using the grafana and prometheus exporters.
Example
Here is an example of a metrics middleware.
// main.go
package main

import (
	"log"
	"net/http"

	"github.com/seiortech/mahakam"
	"github.com/seiortech/mahakam/extensions"
	"github.com/seiortech/mahakam/middleware"
)

func main() {
	mux := http.NewServeMux()

	mux.HandleFunc("/", func(w http.ResponseWriter, r *http.Request) {
		w.Write([]byte("Hello, World!"))
	})

	mux.HandleFunc("/foo", func(w http.ResponseWriter, r *http.Request) {
		w.Write([]byte("foo"))
	})

	mux.HandleFunc("/bar", func(w http.ResponseWriter, r *http.Request) {
		w.Write([]byte("bar"))
	})

	metrics := extensions.NewMetrics()
	if err := metrics.Register(mux); err != nil {
		log.Fatalln("Failed to register metrics:", err)
	}

	metrics.StartUptimeTracking()

	s := mahakam.NewServer("0.0.0.0:8080", mux)
	s.Use(middleware.Logger)
	s.Use(metrics.Middleware)
	if err := s.ListenAndServe(); err != nil {
		log.Fatalln("Failed to start server:", err)
	}
}
now, we need to setup our prometheus and grafana exporters. I’m gonna use docker-compose for this.
services:
  server:
    build: .
    restart: always
    container_name: server
    platform: linux/aarch64
    ports:
      - "8080:8080"
  prometheus:
    image: prom/prometheus:v3.4.1
    ports:
      - 9090:9090
    volumes:
      - ./configs/prometheus.yml:/etc/prometheus/prometheus.yml
  grafana:
    image: grafana/grafana:12.0.1
    ports:
      - 3000:3000
    environment:
      - GF_SECURITY_ADMIN_USER=raden
      - GF_SECURITY_ADMIN_PASSWORD=raden123
    volumes:
      - ./configs/grafana.yaml:/etc/grafana/provisioning/datasources/datasources.yaml
      - grafana:/var/lib/grafana

volumes:
  grafana:
After that, we need to create our prometheus and grafana configs. Let’s create a prometheus and grafana config file.
mkdir configs
touch configs/prometheus.yml
touch configs/grafana.yaml
Then, let’s create our prometheus config file.
global:
  scrape_interval: 5s
  evaluation_interval: 5s

alerting:

rule_files:

scrape_configs:
  - job_name: prometheus
    static_configs:
      - targets: ["prometheus:9090"]
  - job_name: server
    static_configs:
      - targets: ["server:8080"]
Now, let’s create our grafana config file.
apiVersion: 1
datasources:
  - name: Main
    type: prometheus
    url: http://prometheus:9090
    isDefault: true
Before we start our prometheus and grafana containers, we need Dockerfile for building our server.
FROM golang:1.24.3-alpine AS build

WORKDIR /app

COPY go.mod ./

RUN go mod download && go mod verify

COPY . .

RUN go build -o /server example/metrics/cmd/main.go

FROM alpine

WORKDIR /app
RUN mkdir -p /app/logs

COPY --from=build /server /app/server

ENTRYPOINT ["/app/server"]
Now, let’s run our docker-compose.
docker-compose up -d
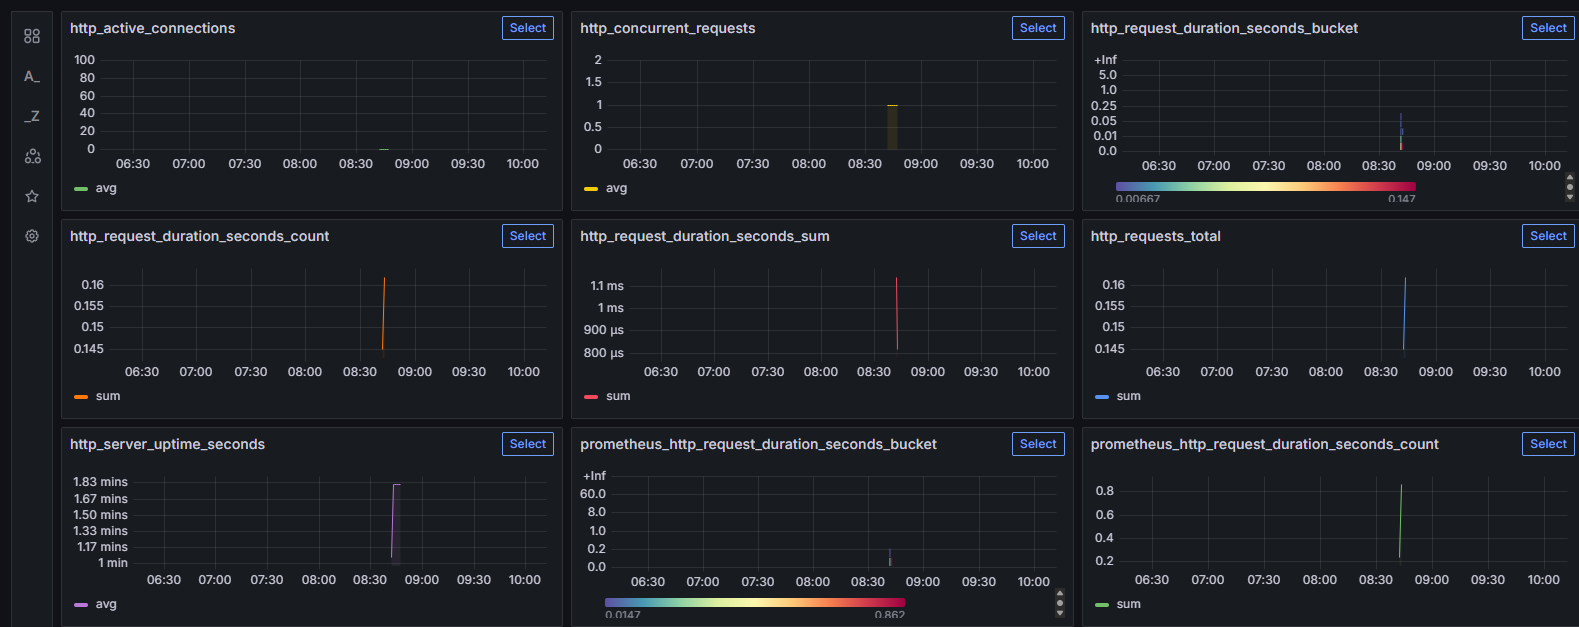
After that, we can access our grafana dashboard at http://localhost:3000/.
configs/grafana.yaml file.
Implementation
You can check out the Mahakam repository for the metrics example.